initial public offerings (IPOs) trading on American exchanges
Showing posts with label PLAY. Show all posts

Tuesday, September 10, 2019

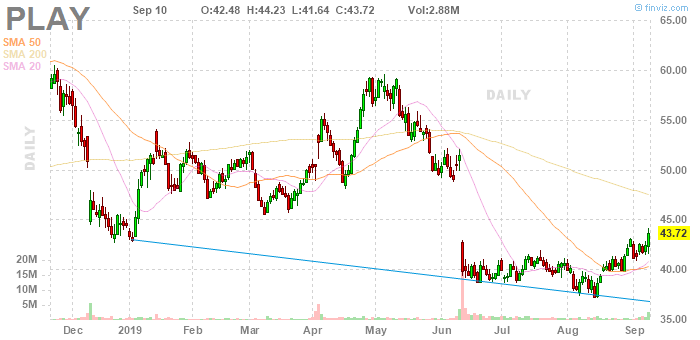
Dave & Busters (PLAY) reported earnings on Tue 10 Sept 19 (a/h)

** charts before earnings **


** charts after earnings **


Dave & Busters beats by $0.05, reports revs in-line; lowers FY20 revs, comparable store sales, and net income guidance


  • Reports Q2 (Jul) earnings of $0.90 per share, $0.05 better than the S&P Capital IQ Consensus of $0.85; revenues rose 8.0% year/year to $344.6 mln vs the $344.29 mln S&P Capital IQ Consensus.
  • Comparable store sales decreased 1.8%.The decrease in comparable store sales was driven by a 2.0% decline in walk-in sales, which was partially offset by a 0.1% increase in special events sales.
  • In light of the competitive environment and because its value-creation initiatives will take time to execute, PLAY lowers guidance for FY20.
    • Sees FY20 revs of $1.338-$1.359 bln vs. prior outlook of $1.365-$1.390 bln and vs. the $1.37 bln S&P Capital IQ Consensus.
    • Lowers net income guidance to $91-$100 mln from $103-$113 mln.
    • Lowers comparable store sales guidance to -3.5 to -2.0% from -1.5% to +0.5%.
    • Continues to expect 15-16 new stores in FY20.
  • Play is focused on five priorities to drive long-term value creation, including revitalizing existing stores, building deeper guest engagement, disciplined cost management, investing in highest-return new store locations, and continuing capital return to shareholders.
  • Tuesday, June 11, 2019

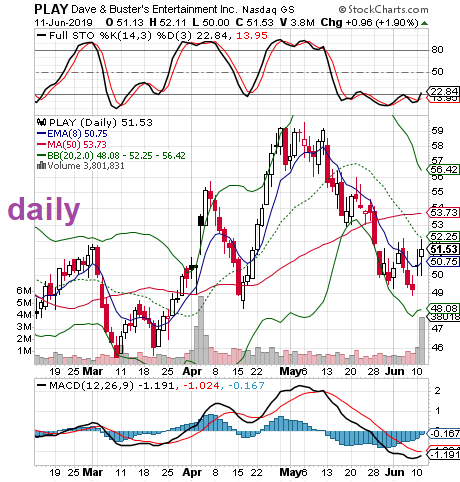
    Dave & Busters (PLAY) reported earnings on Tue 11 June 19 (a/h)

    ** charts before earnings **


    ** charts after earnings **


    Dave & Busters misses by $0.01, misses on revs, comps -0.3% which was below expectations; guides FY20 revs below consensus, lowers full year comp guidance 
    • Reports Q1 (Apr) earnings of $1.13 per share, $0.01 worse than the S&P Capital IQ Consensus of $1.14; revenues rose 9.5% year/year to $363.58 mln vs the $371.72 mln S&P Capital IQ Consensus.
      • Comparable store sales decreased -0.3%. Co says comps were below expectations largely due to the Easter shift, which proved unfavorable this year.
    • Co issues downside guidance for FY20, sees FY20 revs of $1.365-1.390 bln vs. $1.40 bln S&P Capital IQ Consensus and vs prior guidance of $1.37-1.40 bln. Co lowers net income guidance to $103-113 mln from $105-117 mln.
      • Comp guidance for full year was lowered to "-1.5% to +0.5%" from prior guidance of "flat to +1.5%." Co reiterates guidance for 15-16 new stores this year.

    Tuesday, December 11, 2018

    Dave & Busters (PLAY) reported earnings on Tue 11 Dec 2018 (a/h)

    ** charts before earnings **


    ** charts after earnings **

    Dave & Busters beats by $0.06, beats on revs, comps -1.3%; raises lower end of full year revenue guidance
    • Reports Q3 (Oct) earnings of $0.30 per share, $0.06 better than the S&P Capital IQ Consensus of $0.24; revenues rose 12.9% year/year to $282.1 mln vs the $277.3 mln S&P Capital IQ Consensus.
      • Comparable store sales decreased -1.3%, driven by a -0.7% decrease in walk-in sales and a -6.9% decrease in special events sales. Comps in Amusements & Other increased +1.5% but decreased -5.0% in Food & Beverage.
    • Co raises low end of guidance for FY18, sees FY18 revs of $1.243-1.255 bln vs. $1.25 bln S&P Capital IQ Consensus and vs prior guidance of $1.230-1.255 bln. Co guides to FY18 EBITDA of $268-277 mln vs prior guidance of $263-277 mln.
      • Guides to FY18 comps of a decrease of low single digits.
    • For FY19, co guides to revenue being up high single digits with EBITDA up mid-to-high single digits.

    Monday, June 11, 2018

    Dave & Busters (PLAY) reported earnings on Mon 11 June 18 (a/h)

    ** charts before earnings **


    ** charts after earnings **


    Dave & Busters beats by $0.12, beats on revs; reaffirms FY19 revs guidance 
    • Reports Q1 (Apr) earnings of $1.04 per share, $0.12 better than the Capital IQ Consensus of $0.92; revenues rose 9.2% year/year to $332.2 mln vs the $321.57 mln Capital IQ Consensus.
    • Comparable store sales decreased 4.9%. Comparable store sales decrease was driven by a 4.8% decrease in walk-in sales and a 6.4% decrease in special events sales.
    • Co opened six new stores during the quarter.
    • Coreaffirms guidancefor FY19, sees FY19 revs of $1.2-$1.24 bln vs. $1.23 bln Capital IQ Consensus Estimate. Expects comparable store sales to decrease in the low-to-mid single digits. Expects to open 14-15 new stores. Sees net income of approx $95-$110 mln.

    Tuesday, December 5, 2017

    Dave & Busters (PLAY) reported earnings Tue 5 Dec 2017 (a/h)

    ** charts before earnings **


    ** charts after earnings **


    Dave & Busters beats by $0.04, misses on revs; lowers full year revs guidance below consensus 
    • Reports Q3 (Oct) earnings of $0.27 per share, $0.04 better than the Capital IQ Consensus of $0.23; revenues rose 9.3% year/year to $250 mln vs the $255.7 mln Capital IQ Consensus. Comparable store sales decreased 1.3%. Co opened one new store compared to two new stores.
    • Co states that hurricanes during the quarter had an unfavorable impact on our comparable store sales growth, total revenue and EBITDA of approximately 50 basis points, $2 million and $0.7 million respectively. In addition, wildfires had an unfavorable impact on our California stores. 
    • Co lowers guidancefor FY18 (year ends Feb 2018) revs to $1.148-$1.155 bln (previously $1.160-1.170 bln) vs. $1.17 bln Capital IQ Consensus Estimate. Downside guide is primarily driven by the impact of hurricanes, including a delay in our Puerto Rico opening; and reduced comparable store sales guidance. Sees comparable store sales increase of 0.0% to 0.75% (on a comparable 52-week basis) (vs. 1% to 2% previously). Expects to open 14 new stores. Sees Net income of $110-$112 million (vs. $109 million to $113 million previously). 
    • For the following year FY19 (refers to as fiscal 2018), co expects low-double-digit growth in revenue and high-single-digit to low-double-digit growth in EBITDA on a comparable 52-week basis. Co plans to give more comprehensive guidance for next year on fourth quarter 2017 conference call, which is expected in early April 2018. 
    Dave & Busters introduces new smaller store format of 15,000 to 20,000 square feet  
    • In fiscal 2018, co plans to open a total of fourteen to fifteen new stores, representing unit growth of 13% to 14%. These openings will skew towards the large store format and existing markets for our brand.
    • Co also announced a new smaller store format of 15,000 to 20,000 square feet to capitalize on demand in smaller markets not included in original plan. Long term, co sees potential to open 20 to 40 of these stores, including two that are part of 2018 plan. This new format has the potential to expand whitespace opportunity by 10% to 20% beyond the original target of 211 locations in the United States and Canada alone. 

    Tuesday, December 6, 2016

    Dave & Busters (PLAY) reported earnings Tue 6 Dec 2016 (a/h)

    ** charts after earnings **


    Dave & Buster’s Entertainment PLAY released its third quarter fiscal 2016 financial results after the bell, posting earnings of 25 cents per share and revenues of $228.7 million. 
    Beat earnings estimates. The company reported earnings of 25 cents per share, beating the Zacks Consensus Estimate of 13 cents per share and growing a whopping 108% year-over-year. Net income was $10.8 million.
    Beat revenue estimates. The company saw revenue figures of $228.7 million, also beating our consensus estimate of $213 million and growing 18.6% year-over-year.
    Dave & Buster’s saw comparable store sales increase 5.9% during the quarter, compared to an increase of 8.8% in the year-ago period.
    Looking ahead, the company has raised its full-year fiscal 2016 financial outlook. Total revenues are expected to be in the range of $998 million to $1.003 billion. Q4 comps should fall between an increase of 2.5% and 4.5%, while net income is expected to be in the range of $86.5 million to $88.5 million.
    "Dave & Buster's delivered exceptional quarterly results and we are pleased to be increasing our annual guidance. Our strength was broad-based as we experienced momentum across the country and throughout the quarter. Guests responded well to the conclusion of our 'Summer of Games' promotion, along with our subsequent football-related promotions," said Steve King, Chief Executive Officer.

    Tuesday, December 8, 2015

    Dave & Busters (PLAY) reported earnings Tue 8 Dec 2015 (a/h)

    ** charts before earnings **


    ** charts after earnings **


     Dave & Busters beats by $0.09, beats on revs; guides FY16 revs above consensus, same store comps +8.8%  :
    • Reports Q3 (Oct) earnings of $0.12 per share, excluding non-recurring items,$0.09 better than the Capital IQ Consensus of $0.03; revenues rose 17.9% year/year to $192.75 mln vs the $185.39 mln Capital IQ Consensus.
    • Co issues upside guidance for FY16, sees FY16 revs of $857-861 mln vs. $851.78 mln Capital IQ Consensus Estimate and vs prior guidance of $844-853 mln. Co increases FY16 pro-forma net income guidance to $59.0-60.5 mln from $52.5-55.0 mln previously. FY16 comparable store sales guidance increased to +8.5-9.0% from +6.5-7.5% previously.
    • Comparable store sales in Q3 increased +8.8%, inclusive of an estimated negative 110 basis point Halloween calendar shift, and despite lapping an 8.7% gain from the prior year.
    • Co says it's "experiencing a phenomenal year of record results and we are very pleased to be increasing our annual guidance for the third consecutive time."
    • "Guests continued to respond well to our 'Summer of Games' promotion which concluded in [Q3] with our subsequent football-related promotions along with new food and beverage introductions. Our sales strength during the third quarter was well-represented across categories, operating days, day-parts, and geographies."
    • Co is slated to open 8-9 new stores this year, mostly in the large store format, and are projecting 9-10 in 2016 across both store formats. 

    Friday, October 10, 2014

    Dave and Buster's (PLAY) began trading on the NASDAQ on 10 October 2014


    Dave & Buster’s Entertainment Inc. (PLAY), which operates a chain with games and food aimed at adults, surged in early trading after raising $94 million in its initial public offering.

    Dave & Buster’s increased 11 percent to $17.79 as of 11:37 a.m. in New York, giving the company a market value of $696 million. The Dallas-based chain, seeking to repay debt, sold 5.88 million shares for $16 each, according to a statement yesterday, after offering them for $16 to $18 apiece.

    The company joins a number casual-dining companies that have tapped the public markets over the past year. El Pollo Loco Holdings Inc., a chicken restaurant, and Mediterranean-themed Zoe’s Kitchen Inc. (ZOES) completed IPOs this year and have more than doubled since their debuts.

    Dave & Buster’s began after David “Dave” Corriveau, who ran an entertainment venue, teamed up with James “Buster” Corley, who had a restaurant next door in Little Rock, Arkansas, according to Dave & Buster’s website. The two decided to combine their concepts under one roof, opening their first store in Dallas in 1982.

    From 1997 to 2006, Dave & Buster’s operated as a public company until it was acquired by Wellspring Capital Management LLC and HBK Main Street Investors LP. Stephen King, 56, has been the chief executive officer since 2006.

    2011 IPO

    Oak Hill Capital Partners LP purchased Dave & Buster’s in 2010 and filed for an IPO in July 2011, eventually withdrawing the plan the following year, citing market conditions. Oak Hill sought to sell the company earlier this year at a valuation of about $1 billion, drawing interest from Apollo Global Management LLC, people familiar with the matter said in March. Oak Hill didn’t sell shares in the IPO and will own 81 percent after the offering, regulatory filings show.

    Oak Hill, the private-equity firm backed by Texas investor Robert M. Bass, bought Dave & Buster’s in 2010 for $570 million including debt. The firm committed about 96 percent of the deal’s $245.5 million of equity funding, according to filings. Less than a year after the buyout, Dave & Buster’s bought back $95 million of Oak Hill’s shares.

    At the $16 offering price, Oak Hill would have an unrealized gain on its investment of at least 145 percent.

    Dave & Buster’s posted $635.6 million in revenue in the year through Feb. 2, a 4.5 percent gain from the previous year, filings show. A little less than half of that amount was derived from food and beverage sales, while the rest came from entertainment, according to the prospectus.

    Sunday, July 17, 2011

    Dave & Buster's files for a $150 mln IPO

    Dave & Buster's Entertainment Inc., operator of a chain of dining and entertainment venues in North America, filed plans to raise $150 million in an initial public offering to pay down debt.

    Founded in 1982, Dave & Buster's operates 56 stores in 24 states and Canada, as well as one franchised location in Canada. The company's locations sell food and drinks, while offering children and adults a variety of video games, sports-oriented games, interactive simulators and other traditional games.

    Dave & Buster's changed hands last year, when Wellspring Capital Management agreed to sell the chain to Oak Hill Capital Partners in a $570 million deal. Wellspring had taken Dave & Buster's private in 2006 for about $257 million in cash plus debt. It replaced the company's founders with new management, expanded the chain and in 2009, filed to take it public again. But the public markets hadn't been receptive to restaurant stocks, leading to the sale to Oak Hill.


    According to the company's filing with the Securities and Exchange Commission, Dave & Buster's has implemented a number of initiatives to cut costs and streamline operations, while also recently re-engineering its menu. Each of Dave & Buster's locations also contains a bar.

    For the quarter ended May 1, Dave & Buster's reported its profit rose 32% as revenue climbed 5% to $148.6 million.

    The company intends to list its shares on either the New York Stock Exchange or the Nasdaq Stock Market under the symbol PLAY.