initial public offerings (IPOs) trading on American exchanges
Showing posts with label earnings pops. Show all posts

Wednesday, March 17, 2021

Upstart (UPST) reported earnings on Wed 17 March 21 (a/h)

  ** charts after earnings **


Upstart beats by $0.05, beats on revs; guides Q1 revs above consensus; guides FY21 revs above consensus
  • Reports Q4 (Dec) earnings of $0.07 per share, $0.05 better than the S&P Capital IQ Consensus of $0.02; revenues rose 41.9% year/year to $86.7 mln vs the $73.5 mln S&P Capital IQ Consensus.
  • Bank partners originated 123,396 loans across our platform in the fourth quarter of 2020, up 57% from the same quarter of the prior year.
  • Conversion on rate requests was 17.4% in the fourth quarter of 2020, up from 14.9% in the same quarter of the prior year.
  • Co issues upside guidance for Q1, sees Q1 revs of $112-$118 mln vs. $75.30 mln S&P Capital IQ Consensus. Sees adjusted net income of $13.4-$14.2 mln.
  • Co issues upside guidance for FY21, sees FY21 revs of approximately $500 mln vs. $359.45 mln S&P Capital IQ Consensus. Contribution Margin of approximately 41%.

  • Upstart agrees to acquire Prodigy Software; terms not disclosed
  • Upstart has entered into a definitive agreement to acquire Prodigy Software, a provider of cloud-based automotive retail software. With the acquisition of Prodigy, Upstart will accelerate its efforts to offer AI-enabled auto loans through the tens of thousands of auto dealers nationwide where the majority of auto loans are originated.
  • More than $2 bln in vehicle sales have been powered by Prodigy at franchised dealers from brands such as Toyota, Honda, and Ford.
  • The transaction is expected to close in the second quarter of calendar year 2021.
  • Thursday, August 27, 2020

    Nutanix (NTNX) reported earnings on Thur 27 Aug 20 (a/h)

    ** charts before earnings **


    ** charts after earnings **


    Nutanix beats by $0.28, beats on revs; CEO to retire; also announces that Bain Capital will invest in $750 mln in convertible notes


  • Reports Q4 (Jul) loss of $(0.39) per share, excluding non-recurring items, $0.28 better than the S&P Capital IQ Consensus of ($0.67); revenues rose 9.3% year/year to $327.87 mln vs the $319.46 mln S&P Capital IQ Consensus.
  • Co also announces that CEO Dheeraj Pandey plans to retire from the Nutanix management team upon the selection and appointment of Nutanix's next CEO. Pandey will remain Chairman and CEO while a formal search is conducted.
  • Co also announces that Bain Capital Private Equity will make an investment of $750 million in convertible notes. Nutanix plans to use the investment to support the Company's growth initiatives. In connection with the investment, David Humphrey and Max de Groen, Managing Directors of Bain Capital, will join the Nutanix Board of Directors.
  • Friday, January 3, 2020

    Lamb Weston (LW) reported earnings on Fri 3 Jan 20 (b/o)

    ** charts after earnings **


    Lamb Weston beats by $0.09, beats on revs; guides FY20 revs in-line


  • Reports Q2 (Nov) earnings of $0.95 per share, excluding non-recurring items, $0.09 better than the S&P Capital IQ Consensus of $0.86; revenues rose 11.8% year/year to $1.02 bln vs the $0.96 bln S&P Capital IQ Consensus.
  • Co issues guidance for FY20, sees FY20 revs of high end of up mid single digits (cons +7% yr/yr) vs. $4.02 bln S&P Capital IQ Consensus; sees adjusted EBITDA of $965-985 mln
  • Thursday, November 14, 2019

    Farfetch (FTCH) reported earnings on Thur 14 Nov 19 (a/h)

    ** charts before earnings **


    ** charts after earnings **


    Farfetch beats by $0.02, beats on revs


  • Reports Q3 (Sep) loss of $0.18 per share, $0.02 better than the S&P Capital IQ Consensus of ($0.20); revenues rose 93.3% year/year to $255.5 mln vs the $248.31 mln S&P Capital IQ Consensus.
  • Gross Merchandise Value (GMV) increased by $182.0 mln from $310.0 mln in 3Q18 to $492.0 mln in 3Q19, representing year-over-year growth of 58.7%.
  • Digital platform GMV increased to $420.7 mln from $305.9 mln.
  • Gross margin decreased to 45.1% form 50.1%.
  • Adjusted EBITDA loss increased by $3.3 mln, or 10.3%, yr/yr in 3Q19, to $35.6 mln. Adjusted EBITDA Margin improved from (28.7)% to (15.6)% over the same period.
  • Q4 Guidance: Co sees digital platform GMV growth of 30-35%, brand platform GMV of $80-$90 mln, and Adjusted EBITDA loss of ($31)-($21) mln.
  • Wednesday, October 30, 2019

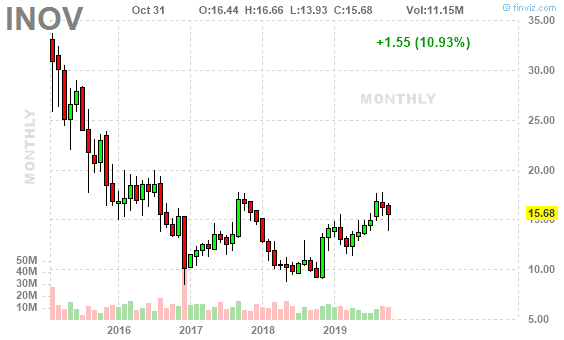
    Inovalon (INOV) reported earnings on Wed 30 Oct 19 (a/h)

    ** charts before earnings **


    ** charts after earnings **


    Inovalon beats by $0.03, reports revs in-line; guides FY20 EPS above consensus, revs above consensus


  • Reports Q3 (Sep) earnings of $0.15 per share, $0.03 better than the S&P Capital IQ Consensus of $0.12; revenues rose 14.2% year/year to $166.5 mln vs the $164.92 mln S&P Capital IQ Consensus.
  • Annual Contract Value (ACV) for new sales totaled $44.1 mln.
  • Reports Adjusted EBITDA of $56.3 mln, up 7% yr/yr, resulting in Adjusted EBITDA margin of 33.8%.
  • Co issues upside guidance for FY20, sees EPS of $0.57-$0.61 vs. $0.56 S&P Capital IQ Consensus; sees FY20 revs of $698-$718 mln vs. $697.73 mln S&P Capital IQ Consensus.
  • Thursday, September 12, 2019

    Vince Holding Corp. (VNCE) reported earnings on Thur 12 Sept 19 (a/h)

    ** charts before earnings **


    ** charts after earnings **


    NEW YORK--(BUSINESS WIRE)--

    Vince Holding Corp. (VNCE), a leading global luxury apparel and accessories brand (“Vince” or the “Company”), today reported unaudited results for the second quarter of fiscal year 2019 ended August 3, 2019.

    Highlights for the second quarter ended August 3, 2019:

    • Net sales increased 13.0% to $71.4 million as compared to $63.1 million in the same period last year.
    • Direct-to-Consumer comparable sales grew 7.1%.
    • Gross margin rate increased 480 basis points to 48.7%.
    • Operating performance improved $4.4 million to $2.0 million compared to an operating loss of $2.4 million in the same period last year.
    • Net earnings improved $4.8 million to net income of $1.0 million or $0.08 per diluted share compared to a net loss of $3.8 million or $0.33 per share in the same period last year.

    Brendan Hoffman, Chief Executive Officer, commented, “We were very pleased with the exceptional top and bottom line performance in the second quarter reflecting double digit sales growth in both our direct-to-consumer and wholesale channels. Our results are evidence that the multiple initiatives that we have been undertaking are coming together to deliver strong performance in all areas of the business.

    We are excited about the momentum in our business as we continue to make progress across our strategic initiatives which include driving global expansion across our retail, e-commerce and wholesale channels as well as increasing brand awareness globally. We believe that we are well positioned within the luxury market to deliver consistent long term profitable growth and enhance shareholder value.”

    For the second quarter ended August 3, 2019:
    • Net sales increased 13.0% to $71.4 million compared to $63.1 million in the second quarter of fiscal 2018. Wholesale segment sales increased 14.7% to $43.4 million as compared to $37.8 million in the same period last year due primarily to the acceleration of seasonal wholesale shipments. Direct-to-consumer segment sales increased 10.6% to $28.0 million compared to the second quarter of fiscal 2018. Comparable sales increased 7.1%, including e-commerce sales, primarily due to an increase in transactions and average dollar sale.
    • Gross profit was $34.7 million, or 48.7% of net sales, compared to gross profit of $27.7 million, or 43.9% of net sales, in the second quarter of fiscal 2018. The 480 basis point increase in gross margin rate was primarily due to product mix, efficiencies in the product development cycle and sourcing initiatives.
    • Selling, general, and administrative expenses were $32.8 million, or 45.9% of sales, compared to $30.1 million, or 47.7% of sales, in the second quarter of fiscal 2018. The growth in SG&A dollars was primarily the result of increased compensation and benefits partially related to growth in stores, increased marketing investments, costs associated with enhancements to our ecommerce and Vince Unfold platforms, as well as higher occupancy costs related to new stores.
    • Operating income was $2.0 million, or 2.8% of net sales. Operating loss was $2.4 million for the second quarter of fiscal 2018.

    Thursday, September 5, 2019

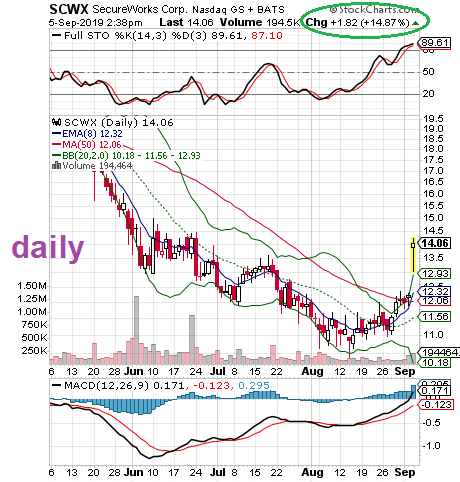
    SecureWorks (SCWX) reported earnings on Thur 5 Sept 19 (b/o)

    ** charts after earnings **


    SecureWorks beats by $0.03, beats on revs; guides Q3 EPS in-line, revs in-line; guides FY20 EPS above consensus, revs above consensus

  • Reports Q2 (Jul) loss of $0.01 per share, $0.03 better than the S&P Capital IQ Consensus of ($0.04); revenues rose 6.1% year/year to $136.6 mln vs the $133.02 mln S&P Capital IQ Consensus.
  • Co issues in-line guidance for Q3, sees EPS of ($0.04)-($0.03) vs. ($0.03) S&P Capital IQ Consensus; sees Q3 revs of $135-137 mln vs. $135.16 mln S&P Capital IQ Consensus.
  • Co issues upside guidance for FY20, sees EPS of ($0.11)-($0.08) vs. ($0.12) S&P Capital IQ Consensus; sees FY20 revs of $540-545 mln vs. $539.68 mln S&P Capital IQ Consensus.
  • Tuesday, September 3, 2019

    Coupa Software (COUP) reported earnings on Tue 3 Sept 2019 (a/h)

    ** charts before earnings **


    ** charts after earnings **


    Coupa Software beats by $0.18, beats on revs; guides Q3 EPS in-line, revs above consensus; guides FY20 EPS above consensus, revs above consensus


  • Reports Q2 (Jul) earnings of $0.07 per share, $0.18 better than the S&P Capital IQ Consensus of ($0.11); revenues rose 54.0% year/year to $95 mln vs the $85.38 mln S&P Capital IQ Consensus.
  • Co issues guidancefor Q3, sees EPS of $0.05-$0.08 vs. $0.06 S&P Capital IQ Consensus; sees Q3 revs of $95.5-$96.5 mln vs. $86.96 mln S&P Capital IQ Consensus.
  • Co issues upside guidancefor FY20, sees EPS of $0.11-$0.16 vs. $0.09 S&P Capital IQ Consensus; sees FY20 revs of $369-$372 mln vs. $347.21 mln S&P Capital IQ Consensus.